

- 873.38 KB
- 2022-08-13 发布

- 1、本文档由用户上传,淘文库整理发布,可阅读全部内容。
- 2、本文档内容版权归属内容提供方,所产生的收益全部归内容提供方所有。如果您对本文有版权争议,请立即联系网站客服。
- 3、本文档由用户上传,本站不保证质量和数量令人满意,可能有诸多瑕疵,付费之前,请仔细阅读内容确认后进行付费下载。
- 网站客服QQ:403074932
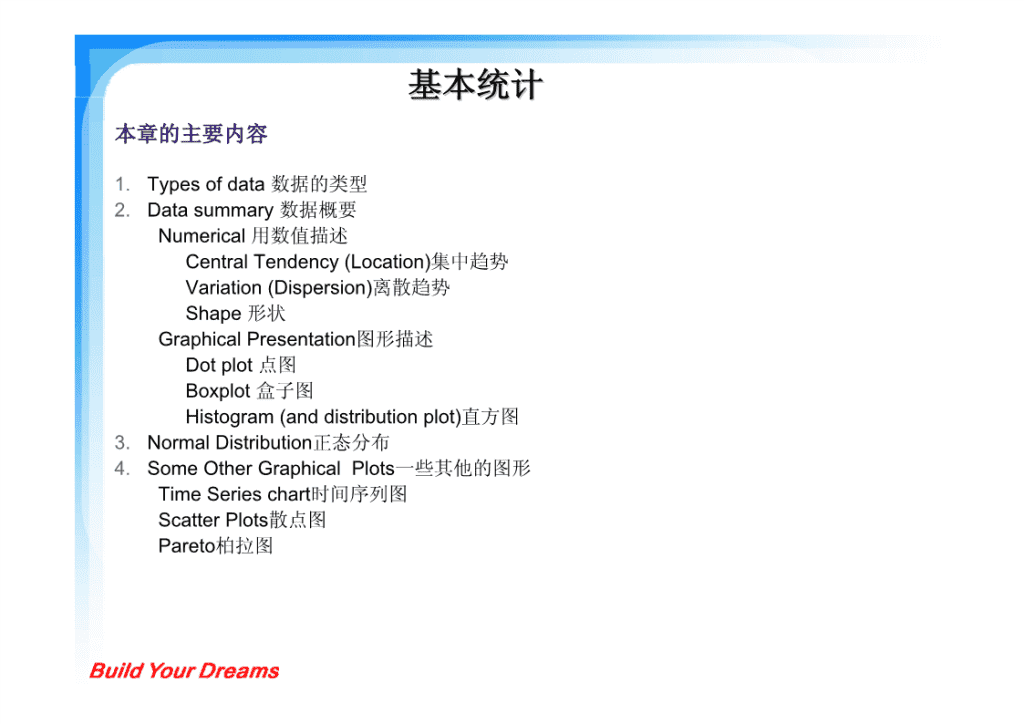
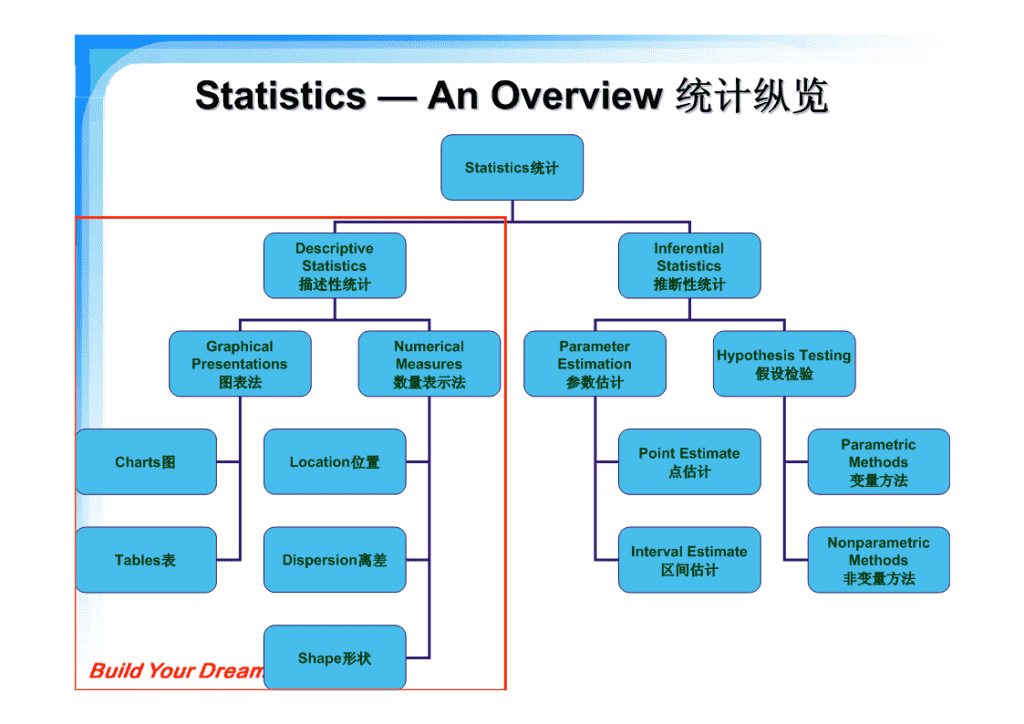
基础统计学基础统计学第四事业部冯春园编写\n基本统计基本统计本章的主要内容1.Typesofdata数据的类型2.Datasummary数据概要Numerical用数值描述CentralTendency(Location)集中趋势Variation(Dispersion)离散趋势Shape形状GraphicalPresentation图形描述Dotplot点图Boxplot盒子图Histogram(anddistributionplot)直方图3.NormalDistribution正态分布4.SomeOtherGraphicalPlots一些其他的图形TimeSerieschart时间序列图ScatterPlots散点图Pareto柏拉图\nStatisticsStatistics——AnOverviewAnOverview统计纵览统计纵览Statistics统计DescriptiveInferentialStatisticsStatistics描述性统计推断性统计GraphicalNumericalParameterHypothesisTestingPresentationsMeasuresEstimation假设检验图表法数量表示法参数估计ParametricPointEstimateCharts图Location位置Methods点估计变量方法NonparametricIntervalEstimateTables表Dispersion离差Methods区间估计非变量方法Shape形状\nTypesofOutputs(Data)TypesofOutputs(Data)输出输出((数据数据))的类型的类型Attribute/DiscreteData(QualitativeorCategorical)属性/离散数据(定性或类别数据)°Categories类别°Yes,No是,否°Go,Nogo去,不去FAILPASS°Machine1,Machine2,Machine3机器1,机器2,机器3失败通过°Pass/Fail通过/失败NO-GOGOElectricalCircuit电流DiscreteData°Maintenanceequipmentfailures,fiberbreakouts,numberofclogs设备故障维修次数,光纤断裂数,障碍的数量ContinuesData连续性数据°Decimalsubdivisionsaremeaningful在一定尺度范围内可以无限细分。°Dimension,chemicalyield,cycletime尺寸,化学反应率,循环时间Caliper卡尺Thermometer温度计Time时间\nTheAdvantageofContinuousDataTheAdvantageofContinuousData连续数据的优点连续数据的优点teContinuousrecisD据连续数据数散离SparseRichWithInformationInformation信息量少信息丰富\nWarmWarm--upExerciseupExercise热身练习热身练习一分钟脉搏跳动次数请各位同学测量一下一分钟的脉搏跳动次数,我们来看一下班级同学的大致身体状况7080707760756893Describethedata..6485描述下列数据78676771Whatarethenumbersthatcanadequatelyrepresent7062thedata?7273什么统计量可以充分的描绘下列数据?8082577572835980\nDataDescriptionDataDescription数据描述数据描述∑CentralTendency(Location)集中趋势(位置)¾Mean均值¾Median中位数¾Mode众数∑Variation(Dispersion)数据的分布趋势¾Range极差¾Inter-QuartileRange四分位数¾Variance方差¾StandardDeviation标准差∑Shape形状¾Skewness偏斜¾Kurtosis峰度\nMeasuresofCentralTendencyMeasuresofCentralTendency集中趋势的测量集中趋势的测量Mean:Arithmeticaverageofasetofvalues均值:算术平均值n¾Reflectstheinfluenceofallvalues反映了所有数据的影响∑¾StronglyInfluencedbyextremevalues特别受极值的影响n=1xnx=nMedian:Reflectsthe50%rank-thecenternumberafterasetofnumbershasbeensorted中位数:数据按顺序重新排列,中间位置所对应的值。¾Doesnotnecessarilyincludeallvaluesincalculation不必考虑所有的数值影响¾Is“robust”toextremescores极值对其影响不显著⎧x([n+1]/2)ifnisodd⎪~x=⎨x(n/2)+x([n/2]+1)ifniseven⎪⎩2Mode:Mostfrequentlyoccurringvalueinadataset众数:出现频率最多的那个数Whywouldwemainlyusethemean,insteadofthemedian,inprocessimprovementefforts?在改进项目的衡量指标中,为何用均值而不用中位数呢?\nCentralTendencyCentralTendency––ExerciseExercise集中趋势集中趋势------练习练习CalculatetheMean,MedianandModeofthefollowingdata计算以下数据的均值,中位数和众数。1,3,3,5,9Mean均值=Median中位数=Mode众数=Minitab:StatÆBasicStatisticsÆDescriptiveStatistics统计Æ基本统计Æ描述性统计\nCentralTendencyCentralTendency––ExerciseExercise集中趋势集中趋势------练习练习Minitab:统计Æ基本统计量Æ显示描述性统计在变量输入Data\nCentralTendency-Exercise集中趋势---练习Minitab:StatÆBasicStatisticsÆDisplayDescriptiveStatisticsMinitab:统计Æ基本统计Æ显示描述性统计\nMeasuresofVariationMeasuresofVariation变异的测量变异的测量Range:极差°Numericaldistancebetweenthehighestandthelowestvaluesinadataset.最大值与最小值之间的数字距离Range=max−minInter-QuartileRange四分位数°Q1=Thefirstorlowerquartileisavaluethathasapproximately25%oftheobservationsbelowinvalue.IQR=q−q四分之一位数:把数据从小到大排列后,25%位置的那个数31°Q3=Thethirdorupperquartileisavaluethathasapproximately75%oftheobservationsbelowinvalue.°四分之三位数:把数据从小到大排列后,75%位置的那个数nVariance(s2):方差2∑(Xi−X)2i=1s=n−1°Theaveragesquareddeviationofeachindividualdatapointfromthemean.每个独立数据点偏离均值的平方的平均值n2∑(Xi−X)StandardDeviation(s):标准差s=i=1n−1°Thesquarerootofthevariance.方差的算术平方根•mostcommonlyusedmeasurementtoquantifyvariability最常用来描述数据变异\nVariationVariation--ExerciseExercise变异变异------练习练习CalculatetheRange,Inter-QuartileRange,VarianceandStandardDeviationofthefollowingdata计算下面数据的极差,四分位数,方差,标准差4Range极差=55Inter-QuartileRange四分位数=38Variance方差=529StandardDeviation标准差=63\nCalculatingStandardDeviation计算标准差2XiXi−X(Xi−X)4-115005003-248395002-3994166113-242SumofsquaresX544∑(Xi−X)4.89方差和22.21∑(Xi−X)/(n−1)\nVariationVariation––ExerciseExercise变异变异------练习练习Minitab:StatÆBasicStatisticsÆDisplayDescriptiveStatisticsMinitab:统计Æ基本统计Æ描述性统计一分钟脉搏跳动次数7080707760756893648578676771706272738082577572835980\nACriticalStatisticalRule!ACriticalStatisticalRule!一条重要的统计规则一条重要的统计规则2Ifσ=varianceoftheprocessoutput;过程中总的方差total2σ=varianceduetoInputVariableX;输入变量X1的方差X112σ=varianceduetoInputVariableX;输入变量X2的方差X22222then于是,σ=σ+σTotalX1X222So,σ=σ+σTotalX1X2\nMeasuresofShapeMeasuresofShape形状的测量形状的测量------偏斜偏斜n()3n∑=x−xi1iSkewness偏度=()()3n−1n−2s\nMeasuresofShapeMeasuresofShape形状的测量形状的测量------峰度峰度n4⎧()()x−x⎫()2⎪nn+1∑i=1i⎪3n−1Kurtosis峰度=⎨4⎬−⎪⎩()n−1()n−2()n−3s⎪⎭()n−2()n−3Kurtosis=-veKurtosis=0Kurtosis=+ve\nMeasuresofShapeMeasuresofShape形状的测量形状的测量Minitab:StatÆBasicStatisticsÆGraphicalSummaryMinitab:统计Æ基本统计Æ图形化汇总一分钟脉搏跳动次数7080707760756893648578676771706272738082577572835980\nMeasuresofShapeMeasuresofShape形状的测量形状的测量Minitab:StatÆBasicStatisticsÆGraphicalSummaryMinitab:统计Æ基本统计Æ图形化汇总一分钟脉搏跳动次数摘要Anderson-Darling正态性检验A平方0.15P值0.952平均值72.692标准差8.652方差74.862偏度0.178916峰度-0.085154N26最小值57.000第一四分位数67.000中位数72.000第三四分位数80.00060708090最大值93.00095%平均值置信区间69.19876.18795%中位数置信区间69.30077.35095%标准差置信区间95%置信区间6.78611.944平均值中位数7072747678\nTheNormalDistributionTheNormalDistribution正态分布正态分布Property1:Anormaldistributioncanbedescribedcompletelybyknowingonlythe:性质一:正态分布可以仅用均值和标准差来描绘.►mean,and►standarddeviationDistributionOneDistributionOne分布一分布一DistributionDistributionTwo分布二Two分布二DistributionThreeDistributionThree分布三分布三Whatisthedifferenceamongthesethreenormaldistributions?三个正态分布有什么不同?Note:AnormaldistributionhasbothSkewnessandKurtosis=0正态分布的偏斜、峰度均为0.\nTheNormalCurveanditsProbabilities正态曲线和它的性质Property2:Theareaundersectionsofthecurvecanbeusedtoestimatethecumulativeprobabilityofacertain“event”occurring性质二:曲线下的面积可以用来估计事件发生的累积概率.Cumulativeprobability68%Cumulativeprobabilityofobtainingavalue40%ofobtainingavaluebetweentwovaluesbetweentwovalues两个数值之间的累积概率30%95%两个数值之间的累积概率20%99.73%10%样本数值的概率0%Probabilityofsamplevalue-4-3-2-101234Numberofstandarddeviationsfromthemean偏离均值的标准差的个数\nNormalProbabilityPlotsNormalProbabilityPlots正态概率图正态概率图Wecantestwhetheragivendatasetcanbedescribedas“normal”withatestcalledaNormalProbabilityPlot我们可以测试一组给定的数据是否是正态分布,称之为正态概率图.Ifadistributionisclosetonormal,thenormalprobabilityplotwillbeastraightline.如果分布近似于正态,那么正态概率图将是一条直线.Minitabmakesthenormalprobabilityploteasy.Minitab将正态性测试变得容易.°OpenDistributions.Mtw打开Distributions.Mtw或拷贝刚才测试的数据到Minitab中°Stat>BasicStatistics>NormalityTest>统计>基本统计>正态性测试Produceanormalplotofeachofthefirst3columns.Whichappeartobenormal?做前三列数据的正态图,哪一个比较象正态分布?Now,graphahistogramofeach.现在,做每一列数据的直方图.Whatdoesthisreveal?这揭示了什么?\nNormalProbabilityPlotsNormalProbabilityPlots正态概率图正态概率图HistogramofNormalHistogramofNegSkewHistogramofPosSkew70250140601202005010040150803060FrequencyFrequency100Frequency2040501020000304050607080901007080901001101201300122436486072NormalPosSkewNegSkewProbabilityPlotofNormalProbabilityPlotofNegSkewProbabilityPlotofPosSkewNormal-95%CINormal-95%CINormal-95%CI99.999.999.9Mean70.00Mean70.00Mean70.00StDev10.00StDev10.00StDev10.0099N5009999N500N500AD0.418AD44.491AD46.48995P-Value0.3289595P-Value<0.005P-Value<0.005909090808080707070606060505050404040Percent30Percent30Percent302020201010105551110.10.10.1020406080100120140020406080100120140020406080100120140PosSkewNormalNegSkew\nMysteryDistributionMysteryDistribution神秘分布神秘分布GenerateaNormalProbabilityPlotforthe“dist4”variableinC4.对C4变量做一个一个正态图.Whatisyourconclusion?Isthisanormaldistribution?你的结论?它是一个正态分布吗?ProbabilityPlotofdist4Normal-95%CI99.9Mean100.0StDev32.3899N500AD27.10895P-Value<0.005908070605040Percent302010510.1050100150200dist4\nNormalDistributionSummaryNormalDistributionSummary正态分布概正态分布概要要SummaryforNormalGeneralGuidelines:Anderson-DarlingNormalityTest总的指南A-Squared0.42P-Value0.328WecanassumethattheMean70.000dataisnormallyStDev10.000Variance100.000distributedifALLtheSkewness-0.050008Kurtosis0.423256followingcriteriaisN500fulfilledMinimum29.8241stQuartile63.412如果能满足以下条件我们Median69.9773rdQuartile76.653认为数据是正态分布的.30405060708090100Maximum103.301•P-value>0.0595%ConfidenceIntervalforMean69.12170.879P值>0.0595%ConfidenceIntervalforMedian•|Skewness|<169.02170.73795%ConfidenceIntervals95%ConfidenceIntervalforStDev偏斜<19.41610.662•|Kurtosis|<1Mean峰度<1Median69.069.570.070.571.0StatÆBasicStatisticsÆGraphicalSummary统计Æ基本统计Æ图形化汇总Variables=Normal\nGraphicalPresentationforDatasummary图形表示数据概要∑DotPlot点图∑BoxPlot盒子图∑Histogram直方图\nDotPlotsDotPlots点图点图NowselectGraphÆDotPlotworksheet:SALES.mtw选择图:图型Æ点图\nDotPlotsDotPlots点图点图DotplotofsalesWhataretheinformationavailableinthe050100salesPlots?图中有哪些用的信息?•CentralTendency集中趋势•Variation变异(离散趋势)•Shape形状\nBoxPlotAnalysisBoxPlotAnalysis盒子图分析盒子图分析*Outlier异常点DistributionMaximum分布最大值(=Min{highestdatapoint,Q3+1.5(Q3-Q1)})最大的数据,Q3+1.5(Q3-Q1)中最小值75thPercentile(ThirdQuartile,orQ3)四分之三位数+Mean均值Median(50thPercentile)中位数(中间的那个数)25thPercentile(FirstQuartile,orQ1)四分之一位数DistributionMinimum分布最小值(=Max{lowestdatapoint,Q1-1.5(Q3-Q1)})最小的数据,Q1-1.5(Q3-Q1)中的最大值\nBoxPlotsBoxPlots盒子图盒子图GraphÆBoxplots图Æ盒子图\nBoxPlotsBoxPlots盒子图盒子图Boxplotofsales1201008060sales40Whatarethe200informationavailableintheBoxplotofsalesvsday120Plots?图中有哪些100可用的信息?8060•CentralTendencysales集中趋势40•Variation20变异(离散趋势)0123456•Shapeday形状\nHistogramHistogram直方图直方图GraphÆHistogram图Æ直方图Histogramofsales161412108Frequency6420020406080100120sales\nHistogramHistogram直方图直方图GraphÆHistogram图Æ直方图\nHistogramHistogram直方图直方图GraphÆHistogram图Æ直方图HistogramofsalesWhatarethe020406080100120information1234availableinthe32Plots?图中有哪些1可用的信息?04564Frequency3•CentralTendency2集中趋势10•Variation020406080100120020406080100120sales变异(离散趋势)Panelvariable:day•Shape形状\nDotplot,Dotplot,BoxplotBoxplot,Histogram,Histogram点图点图,,盒子图盒子图,,直方图直方图Minitab:StatÆBasicStatisticsÆDisplayDescriptiveStatisticsMinitab:统计Æ基本统计Æ描述性统计\nDotplot,Dotplot,BoxplotBoxplot,Histogram,Histogram点图点图,,盒子图盒子图,,直方图直方图BoxplotofsalesbydayIndividualValuePlotofsalesvsday12012010010080806060salessales4040202000123456123456daydayHistogramofsalesbydayIsthereadifferencefromday0204060801001201234today?每天来看,有差异吗?3210456Isyouranswerdifferentwhen4Frequency3youdoingthecomparison21numerically?0020406080100120020406080100120sales你们的答案有差异吗?Panelvariable:day\nDotplot,Dotplot,BoxplotBoxplot,Histogram,Histogram点图点图,,盒子图盒子图,,直方图直方图BoxplotofsalesbydayIndividualValuePlotofsalesvsday12012010010080806060salessales4040202000123456123456daydayHistogramofsalesbyday02040608010012012343Ofthese3graphs,21Whichisbetter?04564三张图中,哪一张比较好?Frequency3210020406080100120020406080100120salesPanelvariable:day\nTimeSeriesPlotsTimeSeriesPlots时间序列图时间序列图GraphÆTimeSeriesPlotTimeSeriesPlotofsales120图Æ时间序列图100Thisproducesasimplerunchartof80thedata.这是一张简单的运行图.60sales4020Youcanalsocreatetheindex017142128354249566370informationinvariousformats.IndexTimeSeriesPlotofsales你可以建立按不同的时间指示时间序120列图100Doubleclickonthex-axis,8060sales双击X轴4020EditScaleÆTimeÆCalendar0Day11210111210111selectDayMonthMonthAprMayJun\nExerciseExercise练习练习∑AssumemachinesA,B,andCmakeidenticalproducts(w/rangechartsincontrol)假定机器A,B,C做同样的产品(极差在控制之中)∑Assumethatthetargetvalueforeachproductoutputvariableis100mm假定产品的输出变量的目标值为100mmAnswerthefollowingquestions:回答下列问题:°Whichmachine(s)exhibit(s)variation?哪一台机器存在差异?°Whereiseachmachinecentered??每一台机器的集中趋势在哪里?°Whichmachinesarepredictableovertime?随时间变化,哪一台机器的输出是可预测的?°Whichmachineshavespecialcausevariation?哪一台机器有特殊原因引起的变异?°Whichmachinewouldyouwantmakingyourproduct?你想用哪台机器制造你的产品?°Whichmachinewouldprobablybeeasiesttofix?哪一台机器最容易固定?°Why?为何?X-barChartforProfileAX-barChartforProfileBX-barChartforProfileC145110120119.7135138.4108.5125nea115Mean105100X=101.0X=100.7115X=115.095mpleMmpleaSa85S93.42SampleMean75906562.93110110.4155010200102001020SampleNumberSampleNumberSampleNumber\nScatterPlotsScatterPlots散点图散点图Thescatterplotlooksattherelationshipbetweentwocontinuousvariables.散点图Scatterplotofsalesvscustomers120表示两个连续数据之间的关系100GraphÆScatterplot8060图Æ散点图sales40EntersalesforYandcustomersforX20选择销售量(Y)对客户(X)05101520customersStat>Regression>FittedLinePlotFittedLinePlotsales=6.787+4.754customers统计>回归>最适合的线图120S17.5573R-Sq51.9%R-Sq(adj)51.2%Thisputthebestfitlinethroughthedata.100通过数据最适合的直线.8060Moreaboutthisinthecorrelationandsales40regressionmoduleinweek220更多的相关与回归的内容在第二星期的课05101520程中.customers\nParetoChartsParetoCharts柏拉图柏拉图Dataiscollectedonthefrequencyofdifferenttypesofdefectseachweek.数据按每周的缺陷类型的频率收集.Thisdataisincludedinthe数据见:Worksheet:pareto.mtwDefectsFreqsWeekAirBubble931AirBubble812AirBubble623AirBubble574WeightDev.1201WeightDev.1322WeightDev.913WeightDev.884Deformation181\nParetoChartsParetoCharts柏拉图柏拉图StatÆQualityToolsÆParetoChartChooseChartdefectstable:选择图中的缺陷表ParetoChartofDefects10001008008060060CountPercent400402002000DefectsWeightDev.AirBubbleColorDeformationCount431293132120Percent44.230.013.512.3Cum%44.274.287.7100.0\nSummarySummary总结总结∑Understandbasicdescriptivestatistics理解基本的描述性统计∑Understandthedifferenttypesofdata.理解不同的数据类型∑Datasummary数据概要•Numerical用数值描述•CentralTendency(Location)集中趋势•Variation(Dispersion)离散趋势•Shape形状•GraphicalPresentation图形描述•Dotplot点图•Boxplot盒子图•Histogram(anddistributionplot)直方图∑NormalDistribution正态分布∑SomeOtherGraphicalPlots另外的图•TimeSerieschart时间序列图•ScatterPlots散点图•Pareto柏拉图\n