

- 167.67 KB
- 2022-08-24 发布
- 1、本文档由用户上传,淘文库整理发布,可阅读全部内容。
- 2、本文档内容版权归属内容提供方,所产生的收益全部归内容提供方所有。如果您对本文有版权争议,请立即联系网站客服。
- 3、本文档由用户上传,本站不保证质量和数量令人满意,可能有诸多瑕疵,付费之前,请仔细阅读内容确认后进行付费下载。
- 网站客服QQ:403074932
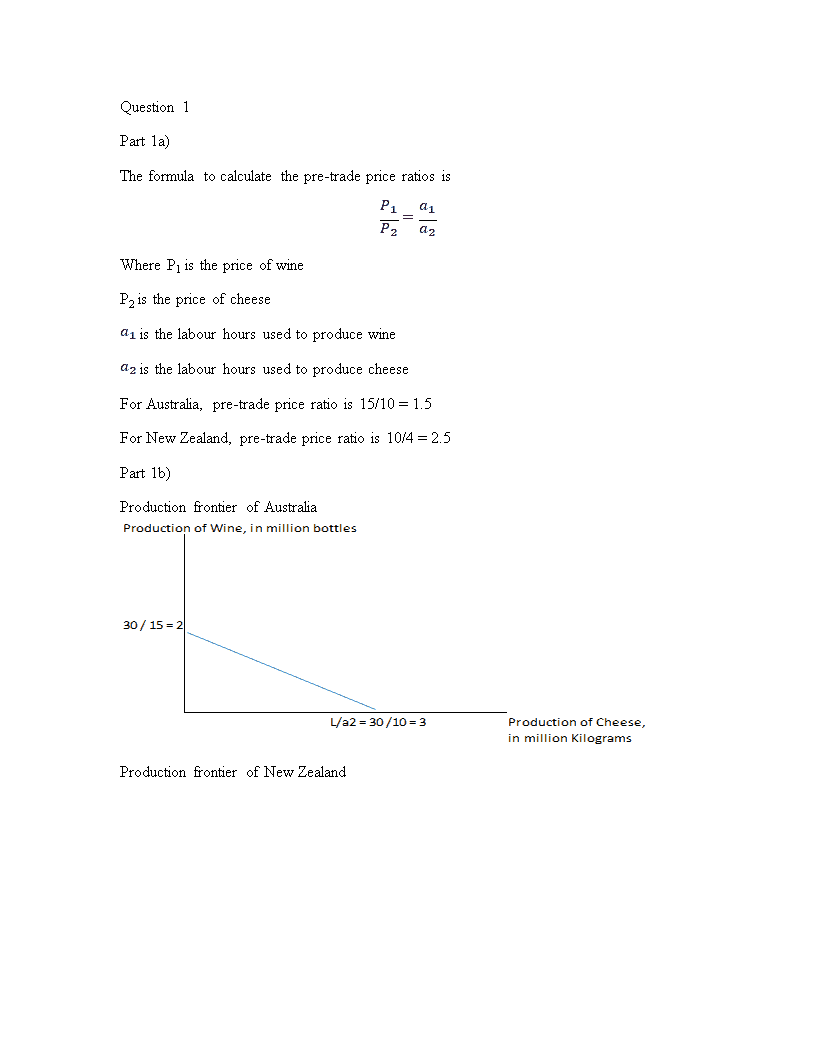
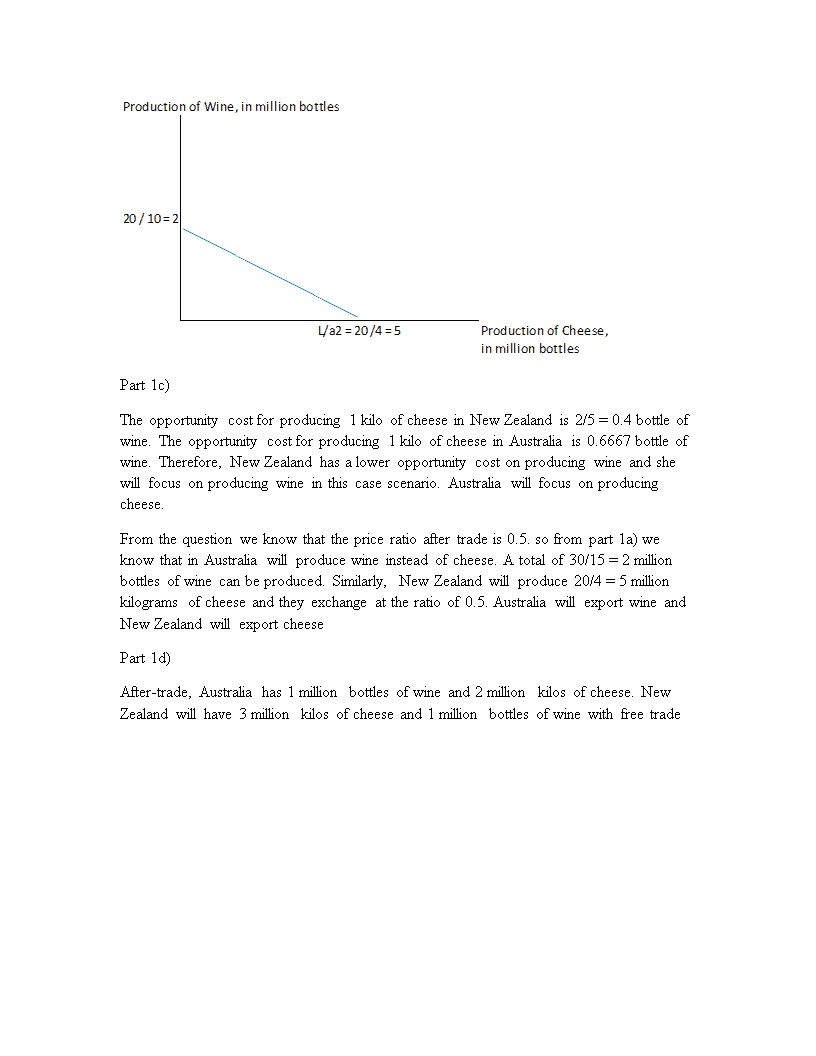
Econ317/417InternationalTradeandPaymentsAssessment\nQuestion1Part1a)Theformulatocalculatethepre-tradepriceratiosisP1P2=a1a2WhereP1isthepriceofwineP2isthepriceofcheesea1isthelabourhoursusedtoproducewinea2isthelabourhoursusedtoproducecheeseForAustralia,pre-tradepriceratiois15/10=1.5ForNewZealand,pre-tradepriceratiois10/4=2.5Part1b)ProductionfrontierofAustraliaProductionfrontierofNewZealand\nPart1c)Theopportunitycostforproducing1kiloofcheeseinNewZealandis2/5=0.4bottleofwine.Theopportunitycostforproducing1kiloofcheeseinAustraliais0.6667bottleofwine.Therefore,NewZealandhasaloweropportunitycostonproducingwineandshewillfocusonproducingwineinthiscasescenario.Australiawillfocusonproducingcheese.Fromthequestionweknowthatthepriceratioaftertradeis0.5.sofrompart1a)weknowthatinAustraliawillproducewineinsteadofcheese.Atotalof30/15=2millionbottlesofwinecanbeproduced.Similarly,NewZealandwillproduce20/4=5millionkilogramsofcheeseandtheyexchangeattheratioof0.5.AustraliawillexportwineandNewZealandwillexportcheesePart1d)After-trade,Australiahas1millionbottlesofwineand2millionkilosofcheese.NewZealandwillhave3millionkilosofcheeseand1millionbottlesofwinewithfreetrade\nThefrontierafterthetradeforAustraliaisshownbelowThefrontierafterthetradeforNewZealandisshownbelowPart1e)Bothcountriesgainfromthetrade.Theconsumptionpossibilitiesarelargerthantheproductionpossibilityforbothcountries,byobservingchartsinpart1d).fromthechart,onecanseethatAustraliacanonlyconsumewithintheproductionfrontierofthechartwhiletheconsumerfrontierbecomestheredlineasindicatedinthechart.Clearlytheareaunderthefrontierislargerwhichmeansthecountryisbetteroff.SimilarargumentcanbedrawnforNewZealand\nQuestion2Part2a)ThepossibleproductionfrontierofHongKongisshownbythefigurebelowAsHongKongislabourabundantandproducingclothesislabourintensive,itislikelythattheunitcostofproducingclothesislowerthanthatofproducingcarinHongKong,resultinginalesssteepslopeinthefrontierThepossibleproductionfrontierofJapanisshownbythefigurebelowAsJapaniscapitalabundantandproducingclothesiscapitalintensive,itislikelythattheunitcostofproducingcarsislowerthanthatofproducingclothesinJapan,resultinginasteeperslopeinthefrontier\nPart2b)Withtheinformationgiven,itisinsufficienttodrawaconclusionthatwhichcountryhasthecomparativeadvantageinproducingclothesorcars.AlthoughitislikelythatHongKonghasacomparativeadvantageinproducingclothes,actualdataisneededtodrawtheconclusionPart2c)ThetheoremsuggeststhatHongKongisrelativelybetteronlabourintensiveindustryandJapanisrelativelybetteroncapitalintensiveindustryandtheywilltradewitheachotherwhichHongKongsellsclothestoJapanandbuyscarsfromJapan.Inaggregateterms,totalproductionpossibilitiesincreaseaftertradePart2d)TheabovescenariocanbeshownbythefollowinggraphexportImport\nQuestion3Part3a)SolvingtheequationandweknowthattheequilibriumquantityQ*solves10+4Q*=100-2Q*Q*=15,P*=70,whenQ*=15Theequilibriumpoint(P*,Q*)=(70,15000)Graphicallyx-axisistherelativequantityofproductXy-axisistherelativepriceofproductXPart3b)FromthedemandcurveP=100–2Q,nowP=50,thecorrespondingquantitysuppliedisQ=10.QuantitydemandedQ’is25.Therefore,theimportedquantitywouldbeQ’–Q=15,asindicatedinthegraph\nImportedquantity\nPart3c)Asitisasmallcountry,atariffcannotlowertheforeignpriceofthegooditimports.Asaresultthepriceincreasesby20%accordingandthenewpriceafterthetariffis1.2P*=60.ThenewquantityimportedisshowninthegraphtariffPart3d)Consumersurplus(CS)afterthetariffisP’*Q’/2,P’=60,Qd’=20000,thereforeCS=20*1000*60/2=600,000Producersurplus(PS)afterthetariffisP’*Q’/2,P’=60,Qs’=12500,thereforePS=12.5*1000*60/2=375,000ThetaxcollectedafterthegainisQd-Qs=7.5*1000/2=225,000\nQuestion4ThecorrespondingexportsofXiscalculatedbelowWiththeapplicationoftheformulaasbelowTheoffercurveisshownasbelowX-axisisthequantityofexportssuppliedandY-axisshowstheimportsofYcorrespondingtotheexportsbyXTheformulaforcalculatingelasticityofdemandised=Q2-Q1P2-P1P1Q1WhereQ2isthenewquantitydemanded\nQ1istheoldquantitydemandedP2isthenewpriceP1istheoldpriceSubstitutingrelevantnumbers,wegetFrom(a)to(b),ed=1.3,from(b)to(c):ed=1.0,from(c)to(d),ed=0.65DetailedcalculationcanbefoundbelowFrom(a)to(b),ed=46-202-1120=1.3,demandiselasticFrom(b)to(c),ed=69-463-2146=1.0,demandisindifferentFrom(c)to(d),ed=84-694-3169=0.65,demandisinelastic\nQuestion5Inthefreearea,thesmalleconomywillincreasetheiraggregateimportasthetariffhasbeenremoved.However,inthiscasescenario,theamountofimportfromcountriesthatwouldbeinfreetradeareaincreasesandthesmalleconomyreducestheimportfromthelowercostcountrieswhicharenotmembersofthefreetradearea.\nQuestion6Part6a)TheformulatocalculatetheintraindustryindexforacommodityisI=1-Export-ImportExport+ImportWiththeaboveformula,theintraindustryindexofindividualgoodsforeachcountryiscalculatedandshownasbelowPart6b)Similarly,theintraindustryindexforeachcountrycanbecomputedusingthesamemethod.Theresultisshownbelow\nPart6c)Basedontradetheory,countryChaslargepartoftradeintraindustryastheindexofcountryCisclosesttooneamongthreecountries.CountryAhastheminimumpartoftradeintraindustryastheindexofcountryAisthelowestamongthreecountries.\nQuestion7ThecalculationoftheAustraliadollarindexcanbesummarizedbythetablebelowTheformulaviewisgivenbybelow\nQuestion8Fromthedefinitionofpurchasingpowerparity,wecanhavethefollowingmathematicaldefinition.Therealeffectiveexchangerate,r,isadjustedfromnominalexchangerate(e)andtheratiooftheforeignpricelevel(Pf)tothedomesticpricelevel(Pd).Mathematically,itcanbeshownasr=e*Pf/PdTherealeffectiveexchangeindexforAustraliain2009,accordingtothedatainthisquestionandquestion7,isshowninthetablebelowTheA$dollarindexshouldbe1.10onthebase1996=1GiventheCPIat169in2009onthebase1996=1,thetheoreticalchangeintheAUWiththerealeffectiveexchangeratelessthan1,Australiaexperiencedarealappreciation.Therefore,theinternationalcompetitivenessofAustraliahasdecreasedduringtheperiod.